There is no ‘one-size-fits-all’ in cancer medicine, as every patient’s tumor is unique. Thus, it is crucial to understand the disease history and every single tumor as best as possible. Comprehensive genomic tumor profiling helps to detect clinically relevant mutations in cancer-associated genes of solid tumors and provides valuable information for selecting the most efficient treatment for each patient.
CancerPrecision® provides an optimal molecular genetic tumor profiling using NGS and forms the basis for personalized, biomarker-based cancer therapy.
We at CeGaT have fully committed ourselves to this aim. With our long-term experience in genetic diagnostics, we have optimized our somatic tumor diagnostics to identify the somatic alterations that promote tumor growth, are responsible for drug resistance, and represent potential therapeutic targets. By using NGS technology, we analyze a panel of more than 700 tumor-associated genes and selected therapy-relevant fusions in more than thirty genes. Optional targeted RNA-based fusion analysis allows the detection of fusion transcripts with de-novo and known partners in more than 150 genes. Variations in these genes are known to significantly impact tumor pathogenesis, progression, and metastasis. Concerning immunotherapies, we determine, tumor mutational burden (TMB), microsatellite instability (MSI), and viral infection (HPV, EBV). In addition, we determine the homologous recombination deficiency (HRD) status, which provides key information, allowing for the prediction of PARP inhibitor- and platinum-based chemotherapy response caused by synthetic lethality. After a processing time of 2–3 weeks, the generated data are summarized in a comprehensive report using current scientific knowledge to support the treating physician in finding efficient treatment for each patient.
Are you insured in Germany? Our colleagues at the Zentrum für Humangenetik Tübingen will gladly support you!

CancerPrecision® Is the First Choice for Tumor Characterization
* Based on a high-quality sample with 20% tumor content for detecting a somatic heterozygous variant.
Our Promise to You

Service Details
- Full sequencing and analysis of more than 700 tumor-associated genes and fusions in more than 30 genes – learn more
- High average sequencing of 500-1,000x coverage allows detection of therapy-relevant variants in subclones
- Sensitivity: > 96%*; Specificity: > 99,9%
- Analysis of tumor mutational burden (TMB), microsatellite instability (MSI), and viral infection (HPV, EBV) — essential biomarkers for immunotherapies — learn more
- Analysis of homologous recombination deficiency (HRD) — an essential biomarker for PARP inhibition — learn more
- Analysis of single nucleotide variants (SNVs), insertions and deletions (indels), translocations, and copy number variants (CNVs) — learn more
- Besides therapy-relevant somatic (tumor-specific) mutations also disease causing and therapy-relevant germline variants are reported
- Selected pharmacogenetically relevant germline variants necessary for drug dose adjustment in your patients
- A list of all eligible drugs, with EMA and/or FDA approval, for which corresponding biomarkers could be detected in the tumor — learn more
- Detection of mosaic variants: CHIP (Clonal Hematopoiesis of Indeterminate Potential)
Optional Service:
- RNA-based fusion transcript analysis from tumor RNA analyzing > 150 genes (CancerFusionRx®) — learn more
* Based on a high-quality sample with 20 % tumor content for detecting a somatic heterozygous variant.
Sample Report
Our Standard Sample Requirements
Normal Tissue
- 1–2 ml EDTA blood (recommended sample type) or
- Genomic DNA (1–2 μg)
Tumor Tissue
Tumor content at least 20%
- FFPE tumor block (min. tissue size 5 x 5 x 5 mm) (recommended sample type) or
- FFPE tumor tissue slides (min. 10 slices 4-10 μm, tissue size 5 x 5 mm) or
- Genomic DNA (> 200 ng) or
- Fresh frozen tumor tissue or
- 3 x 10 ml cfDNA tubes for liquid biopsy
Here you can find more information on how to ship your sample safely.
Further Sample Materials
Other sample material sources are possible on request. Please note: in case of insufficient sample quality or tumor content, the analysis might fail.
If you have more than one option of tumor samples, please get in touch with us (tumor@cegat.com), and we will assist you in choosing the optimal specimen for your patient.
For highest accuracy, we require tumor and normal tissue for our somatic tumor diagnostics panel.
This Is What Makes Our CancerPrecision® Service Special
Understanding the molecular genetic tumor profile is essential for personalizing the patient’s treatment and identifying additional treatment options. The number of markers we address in our CancerPrecision® report is very high. Therefore, the results are grouped into major categories and presented as boxes. The boxes with treatment-relevant findings are highlighted in color.
We present individual boxes for tumor content, TMB, MSI, and HRD scoring of the analyzed tumor sample, structural variant findings, tumor driver mutations, evidence for viral infections (HPV/EBV), germline variants (that explain the patient’s disease), pharmacogenetic variants with implications on cancer treatments, and possible clonal hematopoiesis of indeterminate potential (CHIP).
Tumor to Normal Tissue Comparison
The only accurate way to determine somatic variants
Comparing tumors with matching normal tissue is mandatory for obtaining meaningful results. Diagnostic tests that do not analyze tumors and matching normal tissue usually give non-accurate results. We at CeGaT always sequence tumor tissue and matching normal tissue for our CancerPrecision® diagnostic.
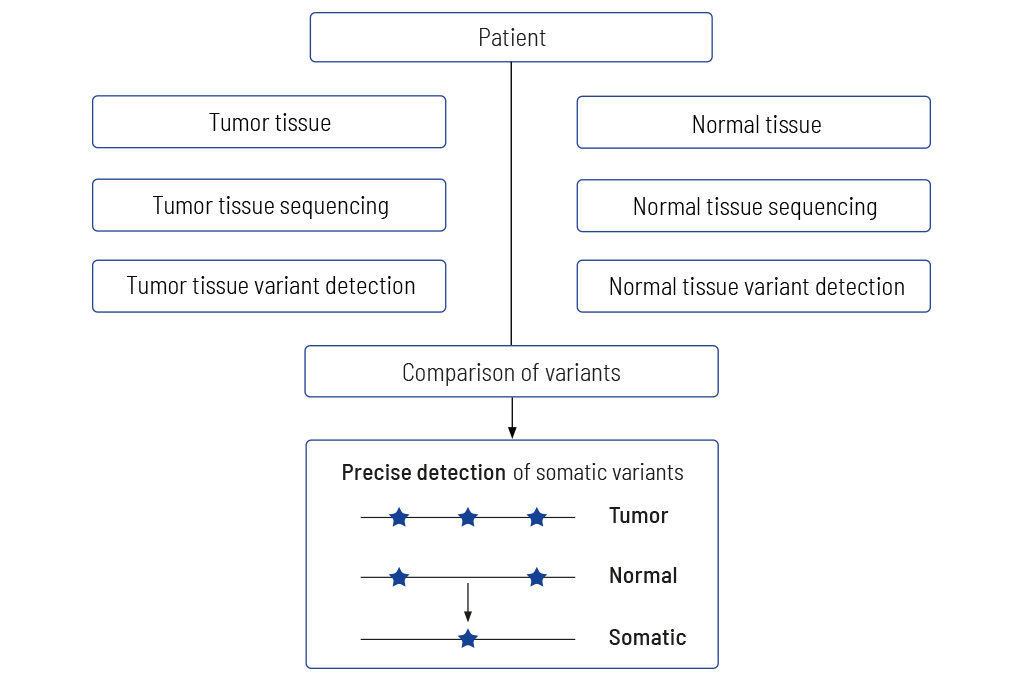
Precise information on tumor genetics is needed for correct interpretation. In tumor diagnostics, it is highly important to discriminate between variants that are restricted to the tumor (somatic variants) compared to those also present in the healthy tissue (germline variants).
The only accurate way to determine variants in the healthy tissue is to sequence the matching normal tissue together with the tumor tissue. Methods trying to replace the sequencing of normal tissue by bioinformatics approaches fail to clearly distinguish between germline and somatic variants, especially when the tumor content of the sample is high1, 2. Sequencing just tumor tissue can lead to an incorrect calculation of the TMB, which in the worst case may result in patients not receiving optimal treatment3.
Therefore, we always sequence DNA from the tumor as well as from normal tissue (mostly blood). The sequencing data of both tissues are compared, and thereby truly somatic variants are determined.
Variants with Potential Therapeutic Relevance
Guidance on potentially effective drugs
For each gene, the somatic change is depicted in detail, and the resulting therapeutic options are stated, including the EMA/FDA approval (A). These options are the basis for discussion in a molecular tumor board (MTB).
At the end of the medical report, in the appendix/supplement, we provide an extensive list of possible therapeutic strategies for each identified somatic change (B). This list includes drug classes and names as well as their approval (FDA/EMA) and limiting conditions.

Sample Report: Exemplary for the BRCA2 variant detected and the resulting therapeutic options in a breast cancer patient. Top panel (A): An excerpt from Table 1 of the findings, listing variants with therapeutic relevance. Lower part (B): An excerpt of the drug listing. In addition to the drugs shown, other drugs are also described.
Pathway Illustration
For a detailed understanding of altered signaling
Cancer arises due to aberrant cell behavior concerning cell growth and survival. Both processes become uncontrollable in the course of tumor development. Typically, all cellular processes are strongly regulated and controlled by a complex network of signaling pathways.
Our medical report provides a comprehensive view of the network of cancer-associated signaling pathways and their molecular “key players” and all relevant genetic alterations and available drug classes to:
- understand the interactions between the different signaling pathways, and
- counteract possible tumor bypass strategies.
Tumors contain mutations in genes that have key roles in these complex signaling pathways. In this context, a single genetic alteration can affect multiple pathways. Thus, it is crucial to understand the interplay of signaling pathways, which are affected by the genetic variants, next to detecting disease-associated mutations. This approach helps to identify possible bypass strategies of a given tumor to consider all possible therapeutic options, including effective combination therapies.
Considered signaling pathways
- Signaling via receptor tyrosine kinases
- Cell cycle
- DNA damage repair
- Hormone pathways
- Wnt pathway
- Hedgehog pathway
- Hippo pathway
- Apoptosis pathway
- Epigenetic regulators
TMB Determination and MSI Prediction
The basis for therapeutic decisions on immunotherapies with checkpoint inhibitors
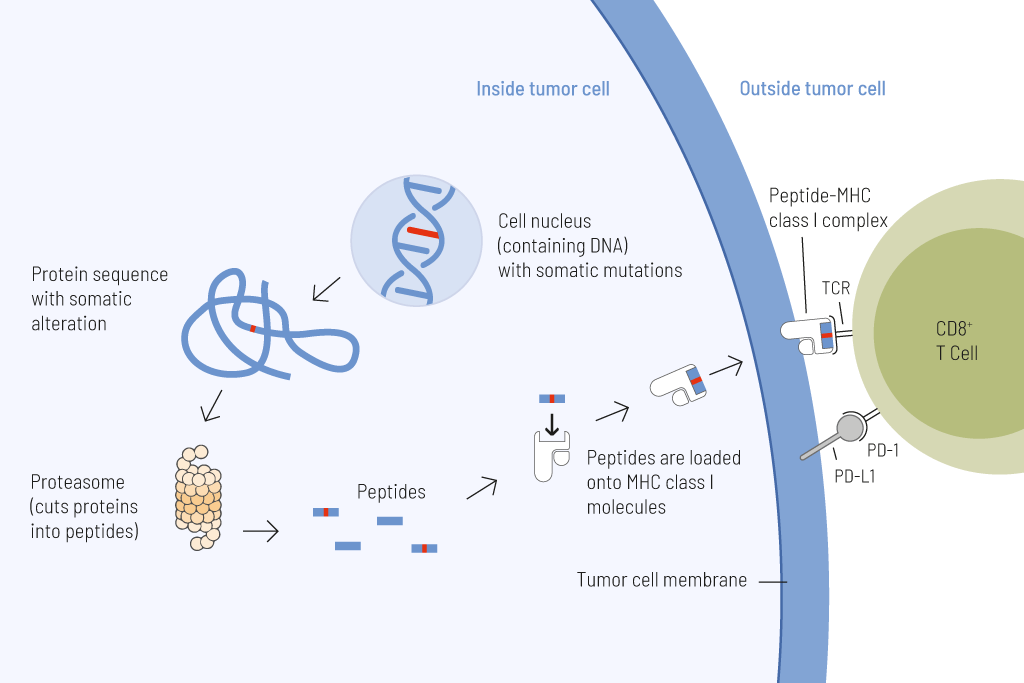
Presentation of tumor cell-derived somatic peptides. Somatic mutations frequently arise in cancer and permanently alter the genomic information. These genetic changes can result in the expression of proteins with altered amino acid sequences. These peptides that carry a somatic change and thus display a particularly strong immunostimulatory potential can be presented on the tumor cell surface and cause an effective anti-tumor immune response.
Tumor mutational burden (TMB) — the number of somatic mutations per megabase (Mut/Mb) — is a reliable predictive biomarker for responses to treatment with immune checkpoint inhibitors.
The higher the number of genetic variations within a tumor cell, the more mutated proteins are expressed. These mutated proteins are processed into short fragments (peptides) presented on the surface of tumor cells. Such mutated peptides are called neoantigens. Neoantigens are highly immunogenic. This means they are very effectively recognized by immune cells, particularly T cells. T cells are able to eliminate tumor cells upon antigen recognition directly. Therefore, the higher the number of mutations, the higher the chance that neoantigens are presented on tumor cells, and thus the more efficient is tumor eradication by T cells.
By sequencing a large gene set of both normal and tumor tissue with high sensitivity, we are able to calculate TMB precisely. This metric is used to categorize tumors into low and high mutational load. We list the classification of TMB, as well as the exact mutation rate of the tumor sample. When calculating TMB, the size of the panel is crucial for the precision of the results. With a size of 2.2 Mb, CancerPrecision® is well above the minimum requirement of 1.5 Mb and ensures a robust estimate of TMB4.
MSI (microsatellite instability) is another crucial parameter for response to immune checkpoint blockade. Microsatellites are small repetitive sequences of DNA located throughout the genome. The size of microsatellites can be altered due to failures of the DNA mismatch repair machinery.
Traditionally, MSI is detected through a comparison of satellite regions in tumor and normal tissue via PCR. However, we at CeGaT can predict the MSI status via NGS. This technique was validated with hundreds of matched normal and tumor sample pairs across various cancer types, testing more than 2,500 target microsatellite foci.
HRD – Homologous Recombination Deficiency
Healthy cells ensure a stable and error-free genome by using different DNA repair mechanisms. Homologous recombination repair (HR) is a DNA repair pathway that acts on DNA double-strand breaks. In case of homologous recombination deficiency (HRD), this pathway is defective so that mutations, chromosomal aberrations, and other errors can accumulate in the genome. Through the resulting genomic instability, HRD facilitates tumor development and has been shown to play a role in various cancers, most prominently in breast and ovarian tumorigenesis5,6.
Loss-of-function genes involved in this pathway can sensitize tumors to PARP inhibitors and platinum-based chemotherapy, which target the destruction of cancer cells by working in concert with HRD through synthetic lethality. To identify tumors where these medications are applicable, reliable determination of the HRD status is of utmost importance.
HR-deficient tumors are often caused by germline or somatic mutations in BRCA1 or BRCA2. Therefore this pattern has formerly been referred to as BRCAness. Moreover, mutations in other HR genes such as RAD51C, ATM, and PALB2 have been shown to cause HRD. It has to be mentioned that not every genetic defect in HR genes necessarily leads to HRD in the tumor. On the contrary, HRD can be caused without a detectable HR gene mutation, such as promoter methylation of BRCAness genes. Thus, if one tries to detect the mutations only in BRCAness genes, a potential HRD may remain undetected. To ensure that HR-deficient tumors are not overlooked, we calculate the HRD score as part of every CancerPrecision® analysis independent of tumor entity.
The HRD score measures overall genomic instability based on the number of indels, substitutions and rearrangements occurring on a genome-wide level. The responsible mutations do not have to be precisely identified for this. To calculate the HRD score of the tumor sample the mutation pattern is used and calculated from three typical HRD events:
- loss of heterozygosity (LOH)
- large-scale state transition (LST)
- telomeric allelic imbalance (TAI)
The HRD score is reported in our CancerPrecision® diagnostic report together with any identified somatic mutations and selected gene fusions as well as TMB, MSI and CNVs to provide a most comprehensive tumor analysis.
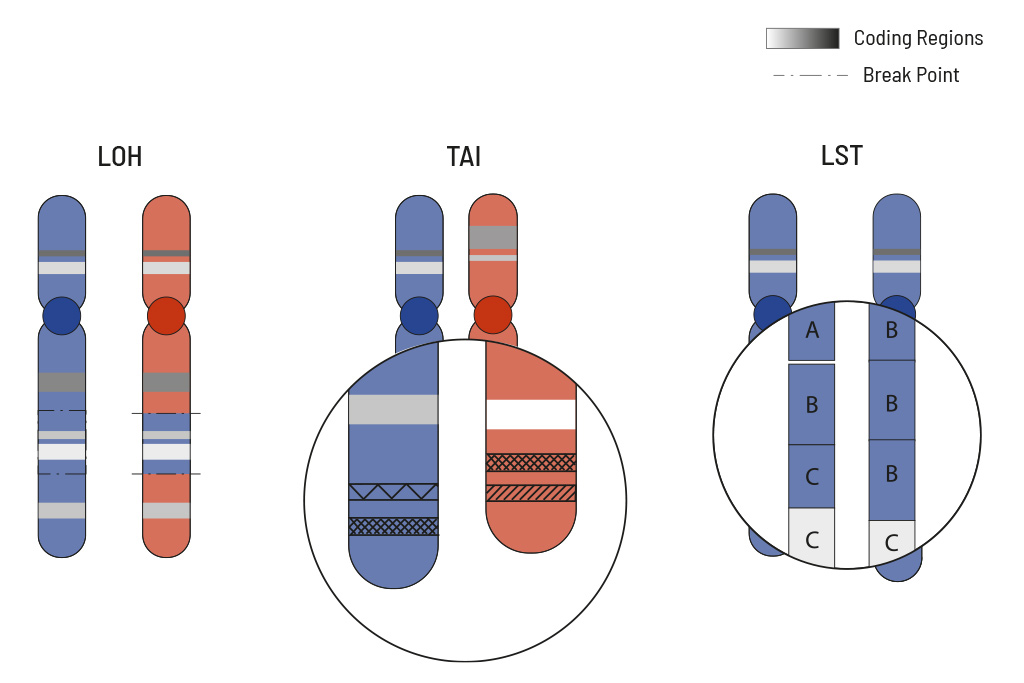
LOH is the irreversible loss of a single parental allele, which is especially severe in cases where defective gene versions are retained. LOH regions are defined as larger than 15 Mb but less than the whole chromosome. TAI occurs when the telomeric end of a chromosome is severely shortened in one of the two paternal chromosomes which causes an allelic imbalance in this region. This imbalance occurs because the repetitive DNA sequences in telomere regions are especially sensitive to HRD.
LST counts the number of transition points between abnormal chromosome regions that generate chromosomal gains or losses larger than 10 Mb.
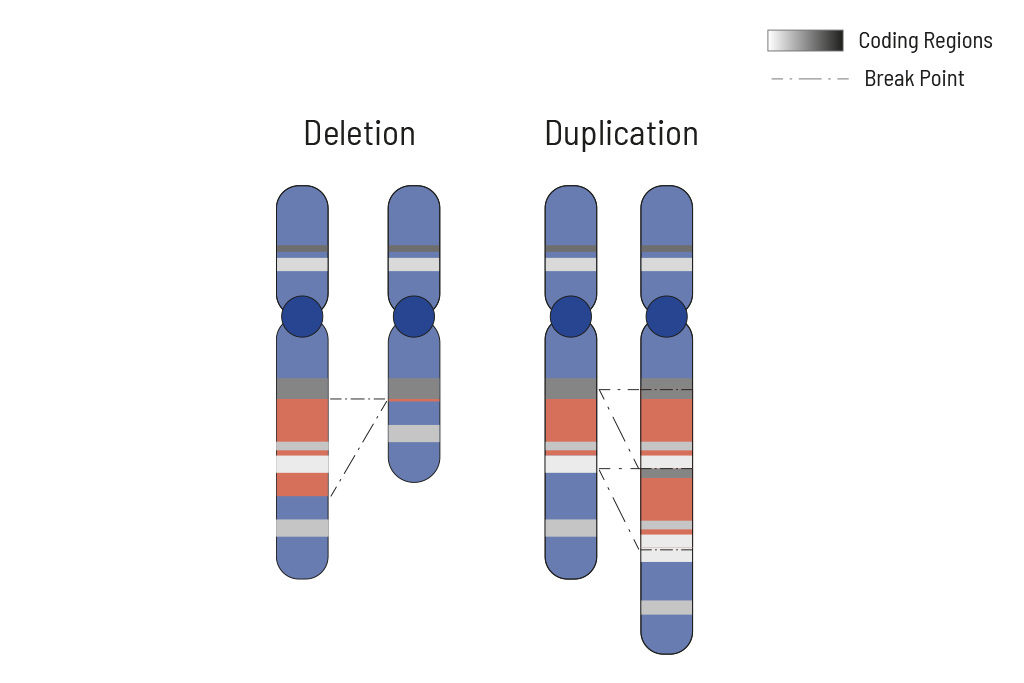
CNV Analysis
Determination of deletions/amplifications for highest therapeutic yield
CNVs (copy number variants) often play an important role in tumor genetics. Knowing the changes in CNVs assists in choosing the optimal treatment. Therefore CNV analysis is an integral part of our somatic tumor diagnostics.
Cellular processes are tightly regulated. This regulation depends on the correct function of genes. In tumors, the copy number of genes is frequently altered, thus impairing the affected genes correct function. Increasing the copy number of a gene can increase its activity, while (partial) deletion can result in a loss of function. Therefore, chromosomal aberrations leading to copy number changes can also have therapeutic consequences.
In tumors, CNVs are frequent due to the overall genomic instability. Here, large chromosomal parts are often either deleted or amplified. Understanding these deletions/amplifications and knowing the genes in the affected region with therapeutic relevance is important. Therefore, deletions and amplifications are detected based on the NGS data obtained.
Deletions and amplifications are listed with the affected genes of therapeutic relevance at the beginning of the report. A complete CNV-profile of the analyzed regions is shown in the report’s appendix.
CancerFusionRx®
RNA-based identification of fusion transcripts
Chromosomal rearrangements frequently occur in all types of cancer. As a result, gene fusions can occur in the cancer genome. Fusions are major drivers of cancer and are therefore most relevant for treatment decisions. Conventional PCR-based methods will not detect a fusion when the other partner is not known (frequently relevant for neutrophic tyrosine kinase, NTRK fusions). Even whole transcriptome analyses are not sensitive enough, especially when the tumor content is low.
To detect all known and previously described as well as novel gene fusions with a therapeutic option, we developed a next-generation targeted enrichment on RNA-basis. The design currently includes over 150 genes for fusion detection and over 120 exon-exon-specific enrichments with known breakpoints. This method is superior to DNA-based methods and also to whole RNA-based approaches. We strongly recommend completing the genetic tumor diagnostic by RNA enrichment for fusions for the most complete understanding of the tumor’s biology.
Gene Directory
Gene list for DNA-based analysis (749 genes, CancerPrecision®, TUM01)
AAK1, ABCB1, ABCG2, ABL1, ABL2, ABRAXAS1, ACD, ACVR1, ADGRA2, ADRB1, ADRB2, AIP, AIRE, AJUBA, AKT1, AKT2, AKT3, ALK, ALOX12B, AMER1, ANKRD26, APC, APLNR, APOBEC3A, APOBEC3B, AR, ARAF, ARHGAP35, ARID1A, ARID1B, ARID2, ARID5B, ASXL1, ASXL2, ATM, ATR, ATRX, AURKA, AURKB, AURKC, AXIN1, AXIN2, AXL, B2M, BAP1, BARD1, BAX, BCHE, BCL10, BCL11A, BCL11B, BCL2, BCL3, BCL6, BCL9, BCL9L, BCOR, BCORL1, BCR, BIRC2, BIRC3, BIRC5, BLM, BMI1, BMPR1A, BRAF, BRCA1, BRCA2, BRD3, BRD4, BRD7, BRIP1, BTK, BUB1B, CALR, CAMK2G, CARD11, CASP8, CBFB, CBL, CBLB, CBLC, CCDC6, CCND1, CCND2, CCND3, CCNE1, CD274, CD79A, CD79B, CD82, CDC73, CDH1, CDH11, CDH2, CDH5, CDK1, CDK12, CDK4, CDK5, CDK6, CDK8, CDKN1A, CDKN1B, CDKN1C, CDKN2A, CDKN2B, CDKN2C, CEBPA, CENPA, CEP57, CFTR, CHD1, CHD2, CHD4, CHEK1, CHEK2, CIC, CIITA, CKS1B, CNKSR1, COL1A1, COMT, COQ2, CREB1, CREBBP, CRKL, CRLF2, CRTC1, CSF1R, CSF3R, CSMD1, CSNK1A1, CTCF, CTLA4, CTNNA1, CTNNB1, CTR9, CTRC, CUX1, CXCR4, CYLD, CYP1A2, CYP2A7, CYP2B6, CYP2C19, CYP2C8, CYP2C9, CYP2D6, CYP3A4, CYP3A5, CYP4F2, DAXX, DCC, DDB2, DDR1, DDR2, DDX11, DDX3X, DDX41, DEK, DHFR, DICER1, DIS3L2, DNMT1, DNMT3A, DOT1L, DPYD, E2F3, EBP, EED, EFL1, EGFR, EGLN1, EGLN2, EIF1AX, ELAC2, ELF3, EME1, EML4, EMSY, EP300, EPAS1, EPCAM, EPHA2, EPHA3, EPHB4, EPHB6, ERBB2, ERBB3, ERBB4, ERCC1, ERCC2, ERCC3, ERCC4, ERCC5, ERG, ERRFI1, ESR1, ESR2, ETNK1, ETV1, ETV4, ETV5, ETV6, EWSR1, EXO1, EXT1, EXT2, EZH1, EZH2, FAN1, FANCA, FANCB, FANCC, FANCD2, FANCE, FANCF, FANCG, FANCI, FANCL, FANCM, FAS, FAT1, FBXO11, FBXW7, FEN1, FES, FGF10, FGF14, FGF19, FGF2, FGF23, FGF3, FGF4, FGF5, FGF6, FGF9, FGFBP1, FGFR1, FGFR2, FGFR3, FGFR4, FH, FLCN, FLI1, FLT1, FLT3, FLT4, FOXA1, FOXE1, FOXL2, FOXO1, FOXP1, FOXQ1, FRK, FRS2, FUBP1, FUS, FYN, G6PD, GALNT12, GATA1, GATA2, GATA3, GATA4, GATA6, GGT1, GLI1, GLI2, GLI3, GNA11, GNA13, GNAQ, GNAS, GNB3, GPC3, GPER1, GREM1, GRIN2A, GRM3, GSK3A, GSK3B, GSTP1, H3-3A, H3-3B, H3C2, HABP2, HCK, HDAC1, HDAC2, HDAC6, HGF, HIF1A, HLA-A, HLA-B, HLA-C, HLA-DPA1, HLA, DPB1, HLA-DQA1, HLA-DQB1, HLA-DRA, HLA-DRB1, HMGA2, HMGCR, HMGN1, HNF1A, HNF1B, HOXB13, HRAS, HSD3B1, HSP90AA1, HSP90AB1, HTR2A, ID2, ID3, IDH1, IDH2, IDO1, IFNGR1, IFNGR2, IGF1R, IGF2, IGF2R, IKBKB, IKBKE, IKZF1, IKZF3, IL1B, IL1RN, ING4, INPP4A, INPP4B, INPPL1, INSR, IRF1, IRF2, IRS1, IRS2, ITPA, JAK1, JAK2, JAK3, JUN, KAT6A, KDM5A, KDM5C, KDM6A, KDR, KEAP1, KIAA1549, KIF1B, KIT, KLF2, KLF4, KLHL6, KLLN, KMT2A, KMT2B, KMT2C, KMT2D, KRAS, KSR1, LATS1, LATS2, LCK, LIG4, LIMK2, LRP1B, LRRK2, LTK, LYN, LZTR1, MAD2L2, MAF, MAGI1, MAGI2, MAML1, MAP2K1, MAP2K2, MAP2K3, MAP2K4, MAP2K5, MAP2K6, MAP2K7, MAP3K1, MAP3K13, MAP3K14, MAP3K3, MAP3K4, MAP3K6, MAP3K8, MAPK1, MAPK11, MAPK12, MAPK14, MAPK3, MAX, MBD1, MBD4, MC1R, MCL1, MDC1, MDH2, MDM2, MDM4, MECOM, MED12, MEF2B, MEN1, MERTK, MET, MGA, MGMT, MITF, MLH1, MLH3, MLLT10, MLLT3, MN1, MPL, MRE11, MS4A1, MSH2, MSH3, MSH4, MSH5, MSH6, MSR1, MST1R, MTAP, MTHFR, MTOR, MT-RNR1, MTRR, MUC1, MUTYH, MXI1, MYB, MYC, MYCL, MYCN, MYD88, MYH11, MYH9, NAT2, NBN, NCOA1, NCOA3, NCOR1, NF1, NF2, NFE2L2, NFKB1, NFKB2, NFKBIA, NFKBIE, NIN, NKX2-1, NLRC5, NOTCH1, NOTCH2, NOTCH3, NOTCH4, NPM1, NQO1, NR1I3, NRAS, NRG1, NSD1, NSD2, NSD3, NT5C2, NTHL1, NTRK1, NTRK2, NTRK3, NUMA1, NUP98, NUTM1, OBSCN, OPRM1, PAK1, PAK3, PAK4, PALB2, PALLD, PARP1, PARP2, PARP4, PAX3, PAX5, PAX7, PBK, PBRM1, PBX1, PDCD1, PDCD1LG2, PDGFA, PDGFB, PDGFC, PDGFD, PDGFRA, PDGFRB, PDK1, PDPK1, PGR, PHF6, PHOX2B, PIAS4, PIGA, PIK3C2A, PIK3C2B, PIK3C2G, PIK3CA, PIK3CB, PIK3CD, PIK3CG, PIK3R1, PIK3R2, PIK3R3, PIM1, PLCG1, PLCG2, PLK1, PML, PMS1, PMS2, POLD1, POLE, POLH, POLQ, POT1, PPM1D, PPP2R1A, PPP2R2A, PREX2, PRKAR1A, PRKCA, PRKCI, PRKDC, PRKN, PRMT5, PRSS1, PSMB1, PSMB10, PSMB2, PSMB5, PSMB8, PSMB9, PSMC3IP, PSME1, PSME2, PSME3, PSPH, PTCH1, PTCH2, PTEN, PTGS2, PTK2, PTK7, PTPN11, PTPN12, PTPRC, PTPRD, PTPRS, PTPRT, RABL3, RAC1, RAC2, RAD21, RAD50, RAD51, RAD51B, RAD51C, RAD51D, RAD54B, RAD54L, RAF1, RALGDS, RARA, RASA1, RASAL1, RB1, RBM10, RECQL4, REST, RET, RFC2, RFWD3, RFX5, RFXANK, RFXAP, RHBDF2, RHEB, RHOA, RICTOR, RINT1, RIPK1, RIT1, RNASEH2B, RNASEL, RNF43, ROS1, RPS20, RPS6KB1, RPS6KB2, RPTOR, RSF1, RUNX1, RYR1, SAMHD1, SAV1, SBDS, SCG5, SDHA, SDHAF2, SDHB, SDHC, SDHD, SEC23B, SERPINB9, SETBP1, SETD2, SETDB1, SF3B1, SGK1, SH2B1, SH2B3, SHH, SIK2, SIN3A, SKP2, SLC19A1, SLC26A3, SLCO1B1, SLIT2, SLX4, SMAD3, SMAD4, SMARCA4, SMARCB1, SMARCE1, SMC1A, SMC3, SMO, SOCS1, SOS1, SOX11, SOX2, SOX9, SPEN, SPINK1, SPOP, SPRED1, SRC, SRD5A2, SRGAP1, SRSF2, SSTR2, SSX1, STAG1, STAG2, STAT1, STAT3, STAT5A, STAT5B, STK11, SUFU, SUZ12, SYK, TAF1, TAF15, TAP1, TAP2, TAPBP, TBK1, TBL1XR1, TBX3, TCF3, TCF4, TCL1A, TEK, TERC, TERF2IP, TERT, TET1, TET2, TFE3, TGFB1, TGFBR2, TMEM127, TMPRSS2, TNFAIP3, TNFRSF13B, TNFRSF14, TNFRSF8, TNFSF11, TNK2, TOP1, TOP2A, TP53, TP53BP1, TP63, TPMT, TPX2, TRAF2, TRAF3, TRAF5, TRAF6, TRAF7, TRIM28, TRRAP, TSC1, TSC2, TSHR, TTK, TYMS, U2AF1, UBE2T, UBR5, UGT1A1, UGT2B15, UGT2B7, UIMC1, UNG, USP9X, VEGFA, VEGFB, VHL, VKORC1, WRN, WT1, XIAP, XPA, XPC, XPO1, XRCC1, XRCC2, XRCC3, XRCC5, XRCC6, YAP1, YES1, ZFHX3, ZNF217, ZNF703, ZNRF3, ZRSR2
DNA-based detection of selected structural variations in these genes
ALK, BCL2, BCR, BRAF, BRD4, EGFR, ERG, ETV4, ETV6, EWSR1, FGFR1, FGFR2, FGFR3, FUS, MET, MYB, MYC, NOTCH2, NTRK1, NTRK2, NTRK3, PAX3, PDGFB, RAF1, RARA, RET, ROS1, SSX1, SUZ12, TAF15, TCF3, TFE3, TMPRSS2
Gene list for RNA-based identification of fusion transcripts (CancerFusionRx®, STR01)
Gene list for de-novo fusion detection
ABL1, ACTB, AFAP1, AGK, AKAP12, AKAP4, AKAP9, AKT2, AKT3, ALK, ASPSCR1, ATF1, ATP1B1, ATRX, BAG4, BCL2, BCOR, BCORL1, BCR, BICC1, BRAF, BRD3, BRD4, c11orf95, CAMTA1, CCAR2, CCDC6, CCDC88A, CCNB3, CCND1, CD74, CIC, CLTC, CNTRL, COL1A1, CREB1, CREB3L1, CREB3L2, CRTC1, DDIT3, DNAJB1, EGFR, EML4, EPC1, ERBB2, ERBB4, ERG, ESR1, ETV1, ETV4, ETV5, ETV6, EWSR1, EZR, FEV, FGFR1, FGFR2, FGFR3, FLI1, FN1, FOXO1, FOXO4, FUS, GLI1, GOPC, GPR128, HMGA2, JAZF1, KIAA1549, KIF5B, LMNA, LPP, MAGI3, MAML1, MAML2, MAML3, MET, MGA, MGMT, MITF, MKL2, MYB, MYC, NAB2, NCOA1, NCOA2, NCOA4, NFIB, NOTCH2, NPM1, NR4A3, NRG1, NRG2, NSD3, NTRK1, NTRK2, NTRK3, NUTM1, PAX3, PAX7, PAX8, PDGFB, PDGFRA, PDGFRB, PHF1, PIK3CA, PLAG1, PML, POU5F1, PPARGC1A, PPP1CB, PRKACA, PRKAR1A, PTPRZ1, QKI, RAF1, RANBP2, RARA, RELA, RELCH, RET, ROS1, RREB1, RSPO2, RSPO3, SDC1, SDC4, SHTN1, SLC34A2, SND1, SQSTM1, SS18, SSX1, SSX2, SSX4, STAT6, STRN, SUZ12, TACC1, TACC3, TAF15, TCF12, TERT, TFE3, TFG, THADA, TMPRSS2, TPM3, TPR, TRIM24, TRIM33, TRIO, VGLL2, WT1, WWTR1, YAP1, YWHAE, ZMYM2, ZNF703
Gene list for selected break points in these fusion genes
AFAP1-NTRK2, ATP1B1-NRG1, BCOR-CCNB3, BRD3-NUTM1, BRD4-NUTM1, CCDC6–RET, CCDC88A-ALK, CD74-NRG1, CD74-ROS1, CLTC-ALK, DNAJB1-PRKACA, EGFR-PPARGC1A, EML4-ALK, ETV6-NTRK2, ETV6-NTRK3, EWSR1-ATF1, EWSR1-ERG, EWSR1-FLI1, EWSR1-WT1, EZR-ROS1, FGFR2-BICC1, FGFR1-TACC1, FGFR2-TACC3, FGFR3-TACC3, KIAA1549-BRAF, KIF5B-ALK, KIF5B–RET, MGA-NUTM1, NAB2-STAT6, NCOA4–RET, NPM1-ALK, NSD3-NUTM1, PAX3-FOXO1, PAX7-FOXO1, PPP1CB-ALK, PRKAR1A-RET, QKI-NTRK2, SDC4-NRG1, SDC4-ROS1, SLC34A2-ROS1, SND1-BRAF, SS18-SSX1, SS18-SSX2, TMPRSS2-ERG, TPM3-ALK, TPM3-NTRK1, TPM3-ROS1, TPR-NTRK1, TRIM24-BRAF, TRIM24-NTRK2, TRIM33-RET, TRIO-TERT
List for specific transcript variants
EGFR del ex2-3, EGFR del ex2-4, EGFR del ex2-14, EGFR del ex2-22 (mLEEK), EGFR del ex5-6, EGFR del ex6-7, EGFR del ex9, EGFR del ex9-10, EGFR del ex10, EGFR del ex12, EGFR del ex25-26, EGFR del ex25-27, EGFR del ex26-27, EGFR VII, EGFR VIII, MET ex14 skipping
References
1 Jones, S. et al. Personalized genomic analyses for cancer mutation discovery and interpretation. Science translational medicine 7, 283ra53; 10.1126/scitranslmed.aaa7161. (2015).
2 Sun, J. X. et al. A computational approach to distinguish somatic vs. germline origin of genomic alterations from deep sequencing of cancer specimens without a matched normal. PLoS computational biology 14, e1005965; 10.1371/journal.pcbi.1005965 (2018).
3 Nassar, A. H. et al. Ancestry-driven recalibration of tumor mutational burden and disparate clinical outcomes in response to immune checkpoint inhibitors. Cancer cell 40, 1161-1172.e5; 10.1016/j.ccell.2022.08.022 (2022).
4 Buchhalter, I. et al. Size matters: Dissecting key parameters for panel-based tumor mutational burden analysis. International journal of cancer 144, 848–858; 10.1002/ijc.31878 (2019).
5 Heeke, A. L. et al. Prevalence of Homologous Recombination-Related Gene Mutations Across Multiple Cancer Types. JCO precision oncology 2018; 10.1200/PO.17.00286 (2018).
6 Nguyen, L., W M Martens, J., van Hoeck, A. & Cuppen, E. Pan-cancer landscape of homologous recombination deficiency. Nature communications 11, 5584; 10.1038/s41467-020-19406-4 (2020).
Further Information
Webinar: Discover the Power of Modern Tumor Diagnostics
Genetic tumor diagnostics can save lives
Contact Us
Do you have a question, or are you interested in our service?
Diagnostic Support
We will assist you in selecting the diagnostic strategy – for each patient.
